How to Understand Latency in Computer Vision Inference Systems
In real-time computer vision systems, latency is not just a metric — it is a constraint tied directly to safety and user experience.
I've worked on systems where end-to-end latency — from receiving streaming video input, running inference, to rendering results on the UI — had to stay under 5 seconds. In more critical cases, such as vehicle-related decision systems, that drops to sub-second response time from signal to controller. Miss that window and you risk an incident.
That difference alone changes how you design everything.
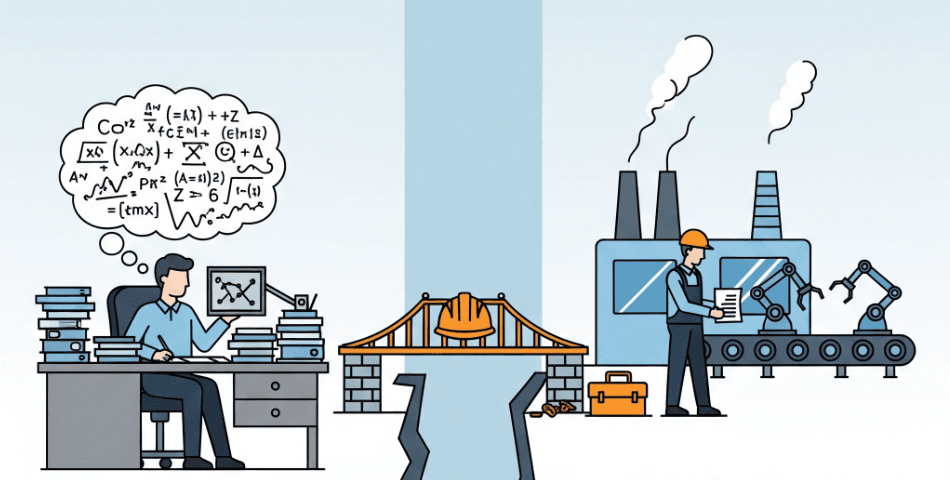
Why the architecture changes when research becomes a product
During research and PoC, everything typically runs on the same GPU server. You read the video file, preprocess the frames, run inference, and get results — all in one place, one script, one machine. Data transfer is not a concern because data never leaves the machine.
But when the work becomes a product, the architecture changes.
The system splits.
A dedicated service handles video stream ingestion — reading from cameras, decoding .mp4 files, managing buffers. A separate service hosts the model inference, because inference needs to scale independently. Depending on the system design, pre-processing and post-processing may also split into their own services to support different inputs and outputs.
Now data is moving between services — frames, tensors, metadata — across a network, through serialization and deserialization, with queueing in between.
That single change — splitting one script into multiple services — is what introduces data transfer as a latency factor. And it is often the first thing that surprises teams when production numbers don't match what they measured on the GPU server.
If you use GStreamer for video ingestion, be aware that its default buffer introduces around 2 seconds of latency before your pipeline even starts processing. It is one of those surprises that only shows up in a real system.
At that point, you are no longer optimizing just model inference — you are optimizing a system. And that distinction matters more than most people realize.
Latency vs Throughput — separating the two
Before going deeper, it helps to separate two terms that often get mixed up.
Latency is the time to process one image end-to-end — say, 200ms per request. Throughput is how many images the system can process per second — say, 20 images/sec.
They pull in opposite directions, and understanding the tradeoff is the first step.
Consider two systems:
System A — 100ms per image, processed sequentially. Fast and responsive for a single request, but limited overall capacity under load.
System B — 300ms per image, processed in parallel with batching. Each request feels slower, but the system handles significantly more volume.
Neither is wrong. Real production systems sit somewhere in this tradeoff space — the right balance depends entirely on what your users actually need. A real-time safety system needs System A thinking. A high-volume batch processing pipeline needs System B thinking. Knowing which one you're building changes every decision that follows.
Where time actually goes — and why the model is rarely the whole story
I've seen engineers benchmark inference on their own GPU servers and get great numbers. Then the same model deploys into a cloud environment and end-to-end latency is completely different.
Local inference performance is not equal to production latency.
In a distributed system, time is spent across every layer:
Network transfer between services
Serialization and deserialization
Request queueing and API gateway overhead
Image preprocessing — decode, resize, normalization
CPU to GPU transfer
Model inference
Post-processing
In many systems, significant latency exists before inference even starts. Attention naturally goes to the model — it's what everyone worked hard on — but preprocessing, CPU to GPU transfer, and API overhead can easily become the actual bottleneck. Isolated GPU benchmarking doesn't show any of this.
How to find where time is actually spent
Per-service metrics alone are not enough. You need to observe the full request lifecycle — not just what happens inside each service, but what happens between them.
The simplest starting point is to generate a request_id (UUID) for every request and propagate it through all services. With consistent logging tied to that ID, you can reconstruct the full timeline:
When the client sends the request
When each service receives it
How long each stage takes — preprocessing, inference, post-processing
When the response travels back through the system
When the client receives the final output
This gives you visibility in both directions — request flow and response flow. Without both, systems often look fast in parts but slow end-to-end.
This is a starting point, not a production solution.
In real production systems, tracing is handled by dedicated tools — Jaeger or OpenTelemetry for distributed tracing, Prometheus for metrics collection, or even structured log output interpreted by observability platforms like Grafana. These give you the full picture automatically, across every service, with dashboards and alerts you can act on.
The UUID approach teaches you the thinking. The production tools do that work at scale.
Start simple to build intuition, then graduate to the right tooling.
The mindset shift that matters
Latency in computer vision systems is an end-to-end property, not a single-component metric.
Optimizing one layer in isolation gives you a partial answer. Understanding how every layer connects — ingestion, transfer, preprocessing, inference, post-processing, response — gives you the real one.
Once you see the system this way, the question stops being "how fast is the model" and becomes "where is time actually spent."
That shift is usually where the real gains are found — and in the next post, I'll walk through how to optimize speed across the full system.